Diagrams
This section describes the various models and diagrams used in TTModeler.
Diagram Principles
There are two diagram types: Canvas and Stack.
Canvas
Context, use case, hardware, and data flow diagram are based on a canvas. The structure of the editor is described in this section.
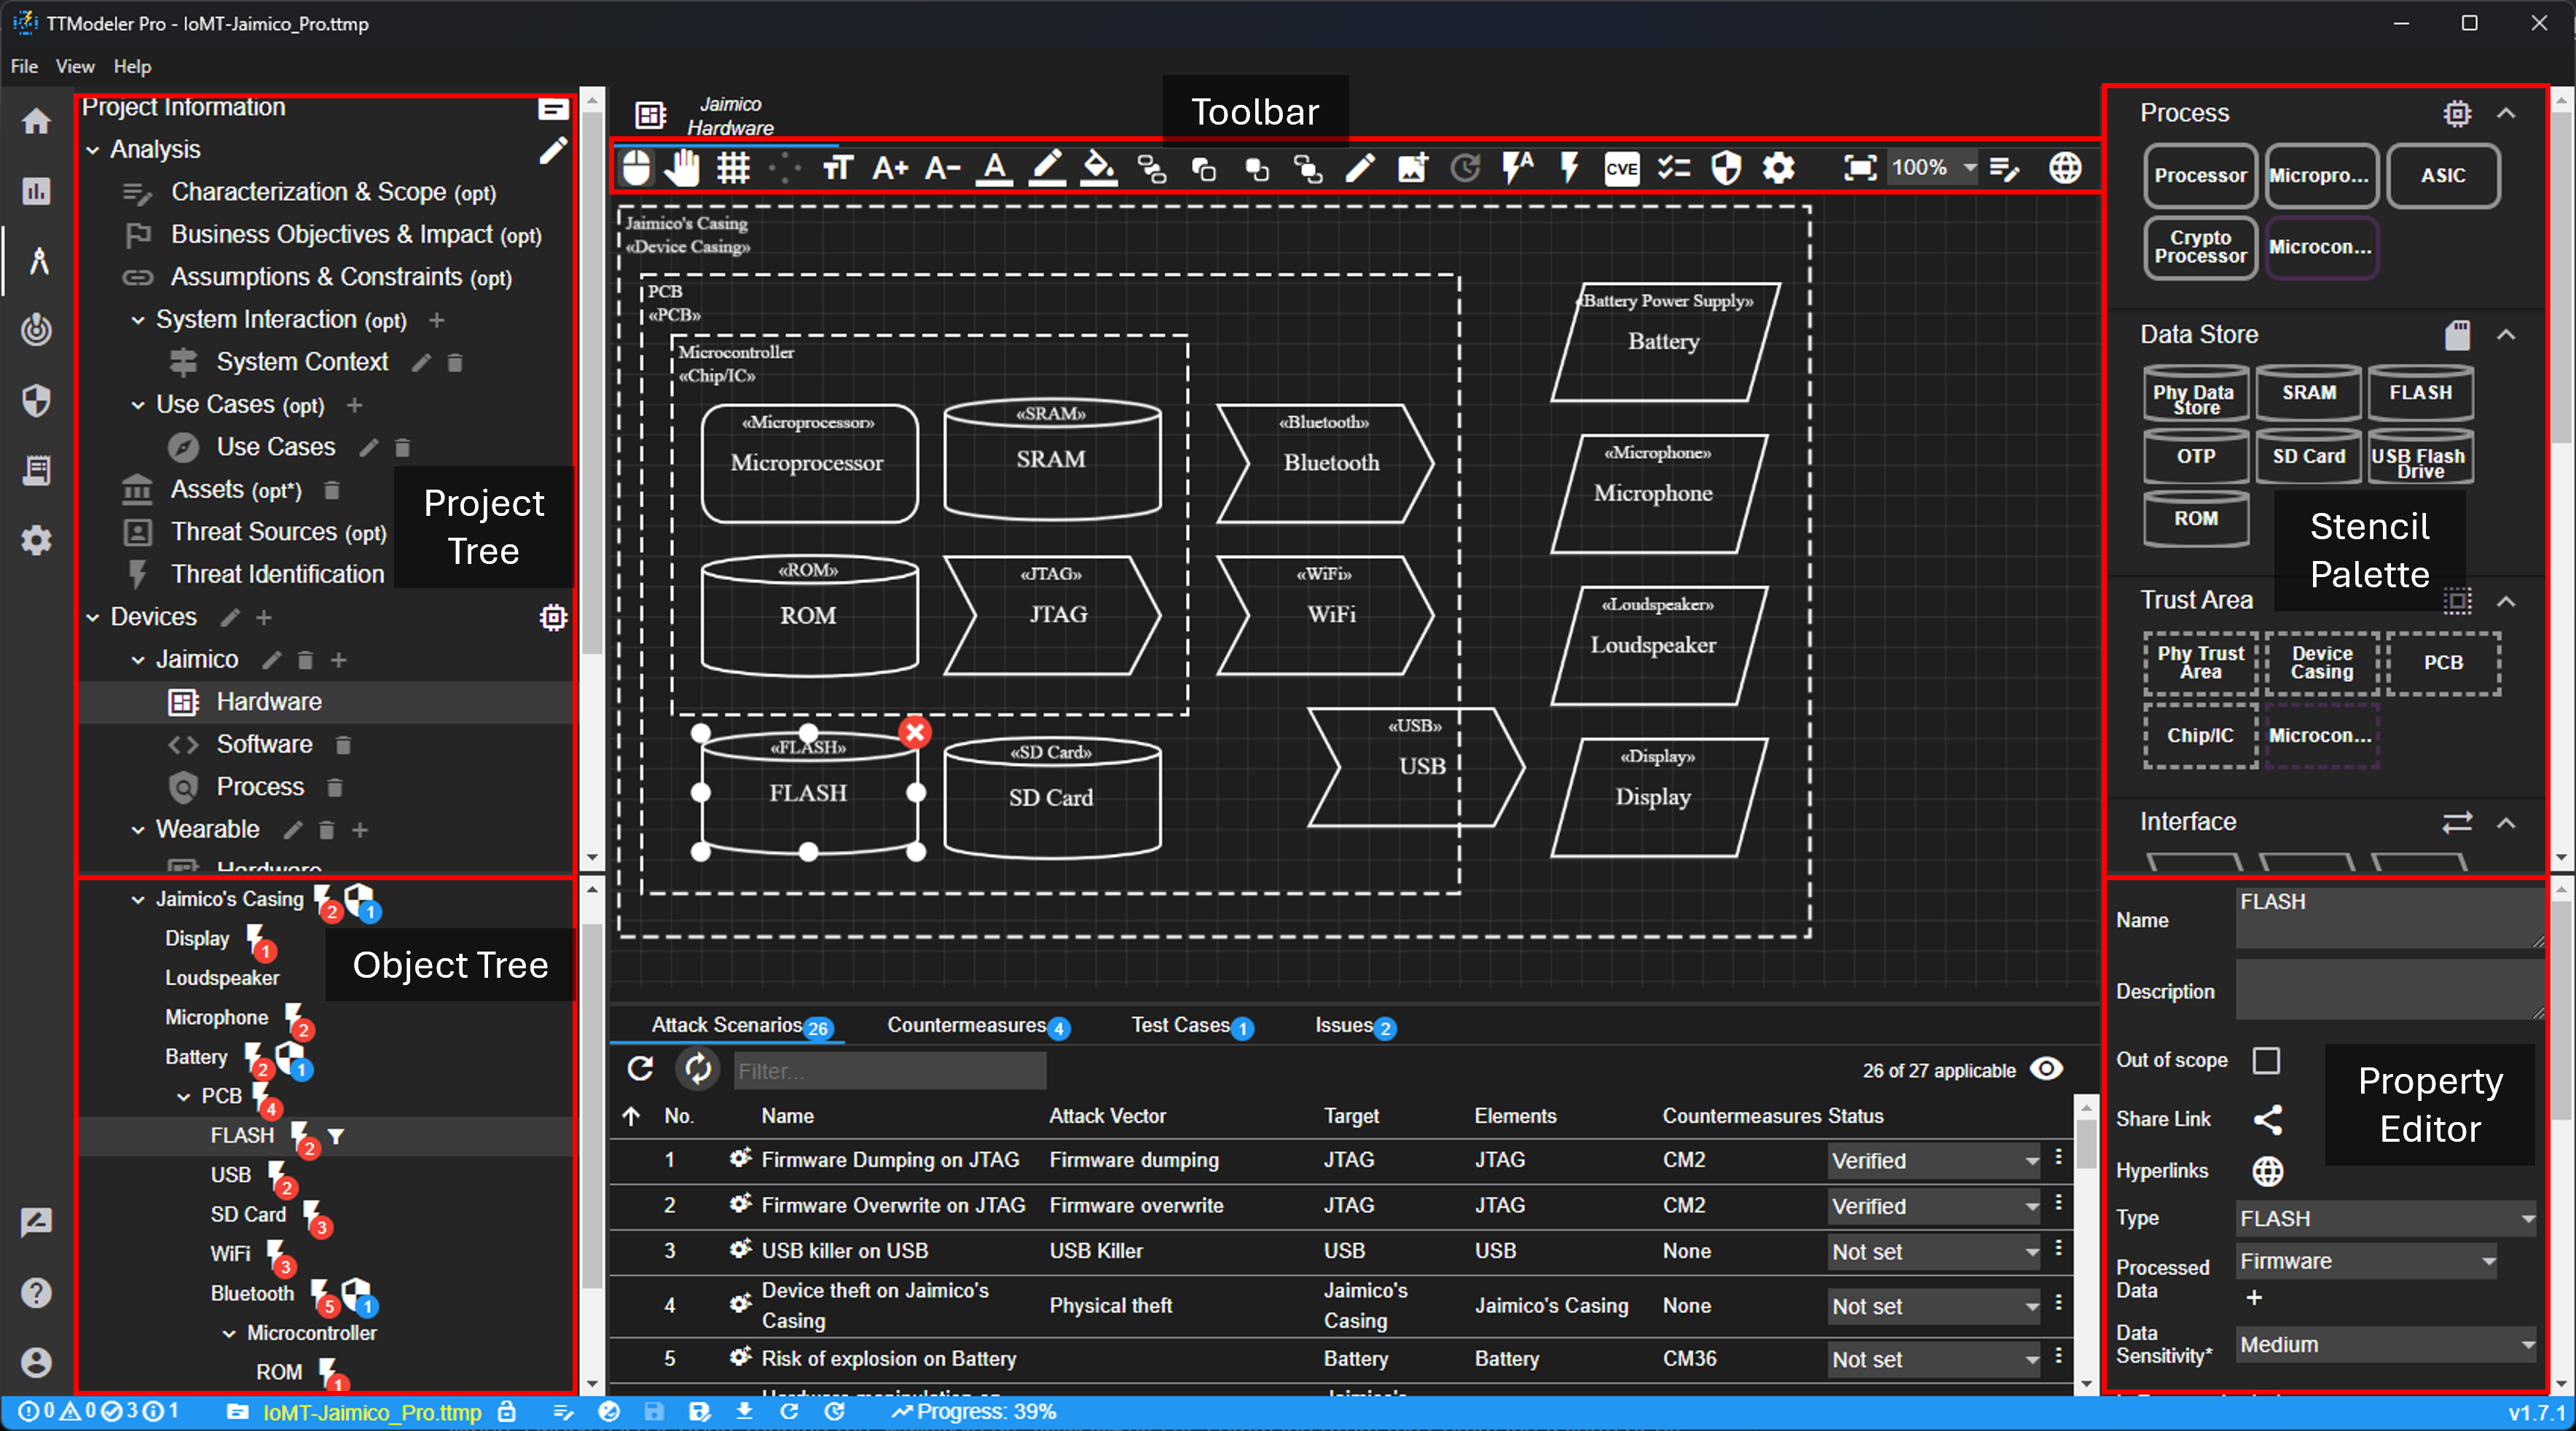
Stencil Palette
New elements can be added to the canvas from the stencil palette (right side bar) via drag and drop. Visual properties such as size and color can be changed via the toolbar. Further (mostly non-visual) properties can be changed via the property editor on the bottom right.
Object Tree
The object tree shows a hierarchical view of the canvas elements. Once an elements moves to another container (trust area), the tree updates its structure. There is a possibility to apply a filter for a certain element. This also updates the tables on the bottom of the editor. It can be searched for elements via the three-dots-menu on the top right.
Toolbar
The toolbar provides several actions related to the canvas in general, specific elements, and general settings. Regarding the canvas in general, it is possible to show/hide the grid, add texts or images, and change the text size. The text size can also be changed for each element specifically. Furthermore, for selected elements threats, countermeasures, and test cases can be added. Last, there are general settings such as (de-)activating the threat generation, activate specific rules, or the asset-based generation (in this case, threat are only generated if associated assets are affected).
Tables
Below the canvas, there are various tables. These tables show attack scenarios, countermeasures, test cases, and issues only for this diagram. The columns in the tables can be sorted and filtered. The columns displayed can be configured using the eye button  . The settings button
  can be used to specify whether referenced elements should also be included. If there are references to these elements in other diagrams, they are also displayed in the table and marked with an arrow
  .
.
Adding a Data Flow
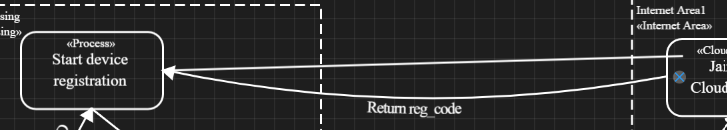
In order to add a data flow, the start and end point must be defined. First, click on an anchor (purple X with gray background) of the sender, and second, on an anchor of the receiver. Anchor point, flow direction, bending etc. can be changed afterwards via the property editor. It can be configured via the toolbar if elements have four or eight anchor points. Creating a data flow can be aborted via toolbar or ESC.
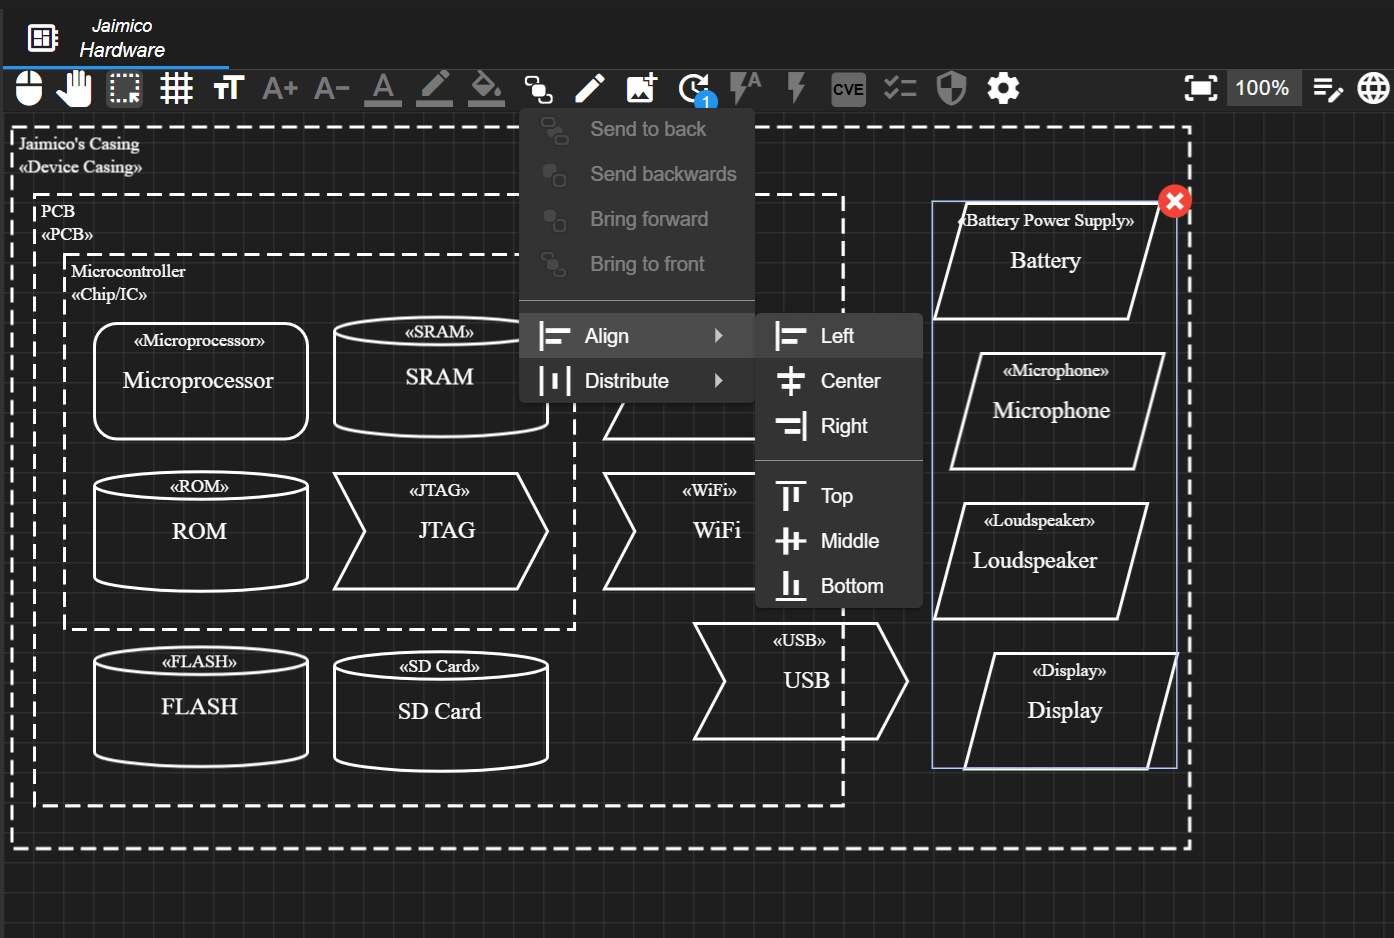
Selection
Multiple elements can be selected and moved as group. The selection can be made by dragging an area or by using the Shift key. Selecting a group of elements inside a trust zone is not that simple, as it would move the trust zone instead. For such cases, element selected can be explicitly set (third button in the toolbar  ). In the arrange menu, elements of a group can be aligned or distributed.
Further Functions
An image of the canvas can be exported to the desktop via right click on the canvas. If a element is selected, further commands are available in the context menu.
The diagram supports some keyboard shortcuts such as F2, Ctrl+C/Ctrl+V, DEL, and ESC.
Stack
The basic functionality of the stack is similar to that of the canvas. The main difference is that the arrangement is more rigid. Components must be assigned to a group; the arrangement then takes place automatically.
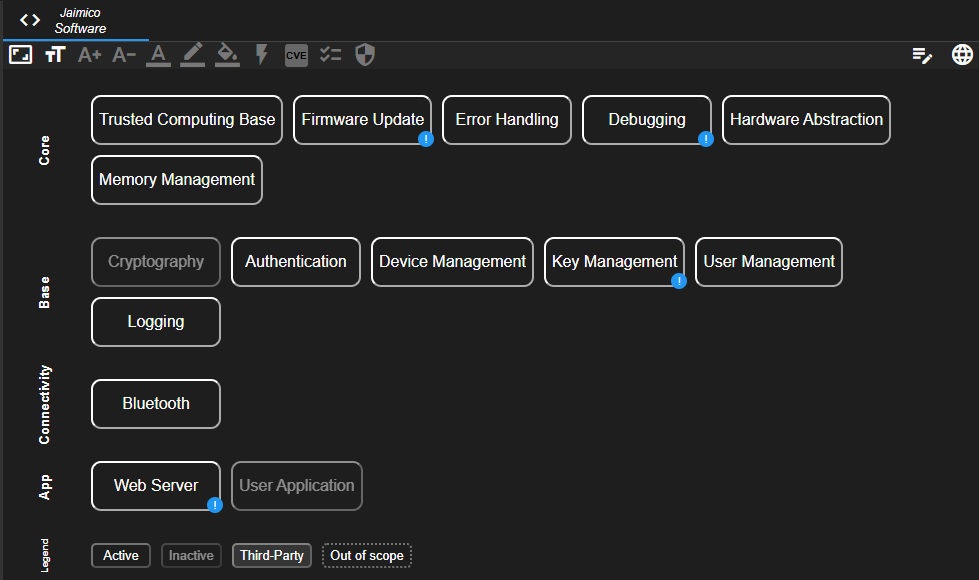
States
Components can have different states. The default state is Active. If a component is deactivated (or not present), it can be set to Inactive. It can be visually highlighted if a component is provided by a Third Party. If the system has a certain software component that is not analyzed as part of the current analysis, it can be set to Out of scope (e.g. when analyzed in a separate analysis).
Questionnaire
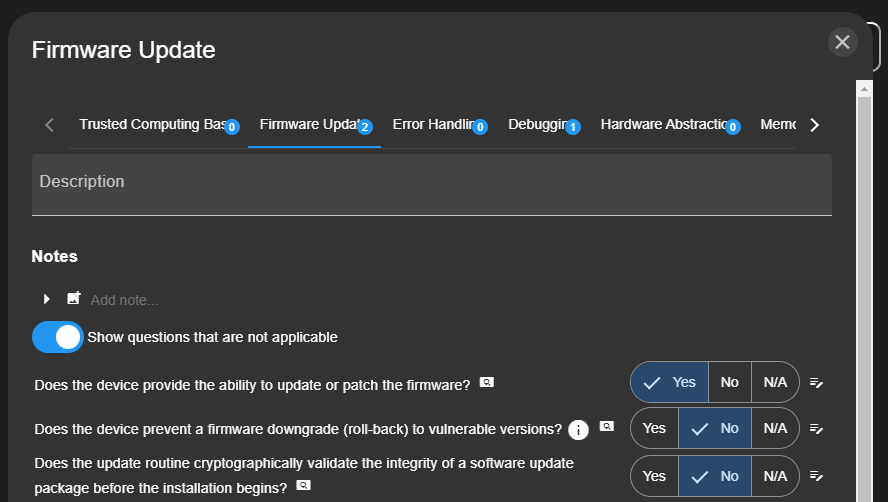
By double clicking on a component, a questionnaire opens. The configurable list of questions should help finding threats against a component. Based on the answer of a question, a related property of the component gets set (which in turn might lead to the generation of a threat).
Special Properties
Software components have a few special properties. First, it can be defined whether it is possible to reference the component. If this property is ticked, the component appears in data flow diagrams as process stencil. Elements based on this stencil reference to the software component. Second, a version for the software can be defined for internal tracking. And third, a port number can be defined. This number will also be displayed in the visual representation of the component.
System Context Diagram
The intention of the system context diagram is to provide an overview of the system. All systems and users should be introduced. Only devices/apps analyzed in the current analysis should be modelled as such type. Systems out of scope should be modelled as external entity.
There are a few specialties of the context diagram. For every device or app added to the canvas, a matching entry will be created in the project tree. If a device/app was created via project tree and is not yet part of any context diagram, it will appear in the stencil palette. For devices/apps it is possible to add interfaces. These can be useful to group interactions. Furthermore, more detailed interfaces can be added.
Every device/app or actor created will also appear in use case diagrams and can be added as reference (indicated by blue color).
See Canvas for editor instructions.
Use Case Diagram
Use case diagrams should cover the main use cases of a system. These use cases should be analyzed in more detail in the form of software components or data flow diagrams as the analysis progresses. Ultimately, they serve to provide a better overview of the system and to assess the completeness of the analysis.
It is not possible to introduce new elements - only existing devices, apps or actors can be referenced.
See Canvas for editor instructions.
Hardware Diagram
The hardware diagram focuses on assessing security risks introduced by the device’s hardware design, with particular attention to exposed interfaces that expand the attack surface. The objectives are:
- Develop a structured model of the device’s hardware.
- Identify built-in hardware security mechanisms.
- Analyze potential threats and attack vectors based on the hardware model.
See Canvas for editor instructions.
Software Diagram
The software model addresses risks introduced by the device’s software stack and its configuration. Particular attention is given to third‑party components, which not only expand the attack surface but also provide a basis for monitoring update requirements. The objectives are:
- Compile a inventory of all software components.
- Assess threats and attack vectors arising from these components.
See Stack for editor instructions.
Data Flow Diagram
The data flow diagram focuses on identifying threats related to data in transit, at rest, and during processing. It extends traditional data flow diagrams with insights from the hardware model and introduces the Physical Link element to represent sensors and actuators, capturing associated privacy and safety risks. The objectives are:
- Provide a visual representation of use cases identified earlier.
- Analyze threats derived from the resulting diagram.
See Canvas for editor instructions.
Process Diagram
Ensuring device security goes beyond threat modeling and requires embedding security into the entire development lifecycle. Missing processes may not cause immediate vulnerabilities but can reveal structural weaknesses. Existing frameworks such as IEC 62443‑4‑1 or OWASP SAMM already cover much of this step. By modeling and visualizing processes, gaps in security practices can be identified. The objectives are:
- Identify security‑relevant processes and requirements.
- Analyze threats and weaknesses arising from incomplete or missing processes.
See Stack for editor instructions.